I’m happy to share with you my first contribution to an open source project. For OpenColorIO, an open source color management library, I added support for Vulkan (you can have a look at the PR here). This allows users to generate GLSL code that is compatible with Vulkan, to set all parameters via a uniform buffer and to set the texture binding indices. The work was done for my daily job and I’m glad that my employer supports open source projects this way and in other ways. It was a nice experience to contribute something to an open source project and I’m excited to see where this will be used!
Status Update / New Music
Unfortunately, I find less and less time to update this page and add new content. I’m still doing graphics programming and switched from OpenGL to Vulkan but besides a lack of time I also haven’t found a good topic for a new demo. GPU ray tracing is exciting to have after all the years so this would be an option.
Another passion of mine is making music, which is a great balance to programming, although music can also get very mathematically. I recently released 11 new songs I made over the last two years. I’m still learning a lot in all aspects of music production and I hope I’m getting better. As usual, most songs are some kind of Heavy Metal, but for friends of undistorted sounds there are also four songs of other genres. For the first track I hired a singer and a drummer on Fiverr to see how that would work out and they really helped to make a musically quite simple song much better. Everything else from recording bass and guitar to mastering was done by me. I hope you can enjoy my music and if you have any feedback let me know:
New Music / New Job
Music Released / Support me on Patreon.com
You can now listen to some of my music (Blues/Rock/Metal/Jazz/Funk) here: Music
And on Soundcloud: https://soundcloud.com/mihomusic
If you like bonzaisoftware.com and want to see more content updates or if you like my music, you can now support me on patreon.com: https://www.patreon.com/mhorsch
Machine Learning with a Multi Layer Perceptron
With all the hype about machine learning and artificial intelligence I thought it would be a good time to refresh my knowledge on the subject. Machine learning meets a lot of scepticism because it is mostly in the media for questionable tasks. Like all tools it can be used for evil things but it also has a lot of beneficial applications. I’m mostly interested in using it for computer graphics, games and tools.
I have implemented a multi layer perceptron in C++, using the Eigen template library for linear algebra. The code is quite simple, it allows to create a neural network with a variable number of layers and nodes per layer, to train the network, to query the network and to reverse query the network.
Continue reading “Machine Learning with a Multi Layer Perceptron”
WebGL Zen Doodle

This new WebGL demo demonstrates the drawing of a triangular zen doodle. Zen doodles are usually small drawings of arbitrary patterns drawn to relax or think.
The demo uses a simple triangle pattern which is created by starting with a triangle. Then, for a certain amount of times, a new triangle is created. Each new triangle (child) is rotated and then scaled to fit within the previously generated triangle (parent). There are other ways to create this pattern but this one very simple. To make things pretty, colors get more saturated to the inside and are animated. The vertices move and change size using some sine waves and the amount of rotation is also animated, giving the image a slow breathing feeling.
From the technical side, figuring out the scaling amount after each rotation is a bit tricky. To make it a bit easier I simply used triangles where all sides have the same length, which allows me to use a uniform scale. To calculate the scaling amount, the intersection of the direction vector (=line from the origin to the rotated first vertex of the parent triangle) with the right side (assuming clockwise rotation) of the parent triangle is calculated. Since everything is calculated relative to the origin, the new scale is given by the length of the intersection vector.
Status Update
Since I didn’t post anything for a while, here is a small status update. In the future I’ll try to make a post when upgrading the blog software.
I’m currently working on a few things, including plans for games, tools, some research and other fun stuff.
WebGL Hello World

This small demo shows the rendering of the earth using HTML5 and WebGL.
The demo uses shaders for per pixel lighting, procedural clouds, atmosphere and a day and night cycle. The high resolution textures are taken from NASAs visible earth gallery. You can move using the WASD keys and change the view by clicking and dragging.
You can try it by clicking on the following link (WebGL-compatible browser required, e.g. Firefox, Chrome, Opera):
Stochastic Order Independent Transparency
The rendering of transparent objects is not an easy task when using z-buffering. The reason is that the way z-buffering works requires to draw all transparent objects from back to front. However, this is not always possible since, for example, two triangles (or objects) could intersect each other, making it impossible to tell which one is in front of the other. To solve this problem, you need an algorithm which is order independent, hence the name order independent transparency. There are already a few algorithms for this: Using an A-Buffer, Depth Peeling , Screen-Door-Transparency and Stochastic Transparency, which I implemented as a test for another demo.
 Continue reading “Stochastic Order Independent Transparency”
LIDAR Rendering
When I had a day off, I thought it would be fun to write a small viewer for LIDAR point cloud data.
Most of the LIDAR data which is freely available in a simple ASCII format or in the LAS file format. While it is quite easy to read the point data from both formats, the LAS format is more flexible and requires more implementation effort.
After writing the reader I tried to render aerial LIDAR point data directly, but it didn’t work as expected. The reason: The file format stores an x, y and z coordinate, but it doesn’t say in which coordinate system. Most of the time, cartographic coordinate systems are used. Fortunately, there is the PROJ4 which allows you to project the point data to a coordinate system which is more useful vor visualization. Since I’m more interested in terrestial LIDAR data, I decided to implement PROJ4 later.
There isn’t much terrestial LIDAR data available for free, however, the UC Santa Barbara provides terrestial LIDAR scans of their campus in the ASCII format. Some data sets are locally aligned, making them well suited for direct rendering.
The following screenshots show my first results, with three data sets which contain about 11.2 million points in real time:

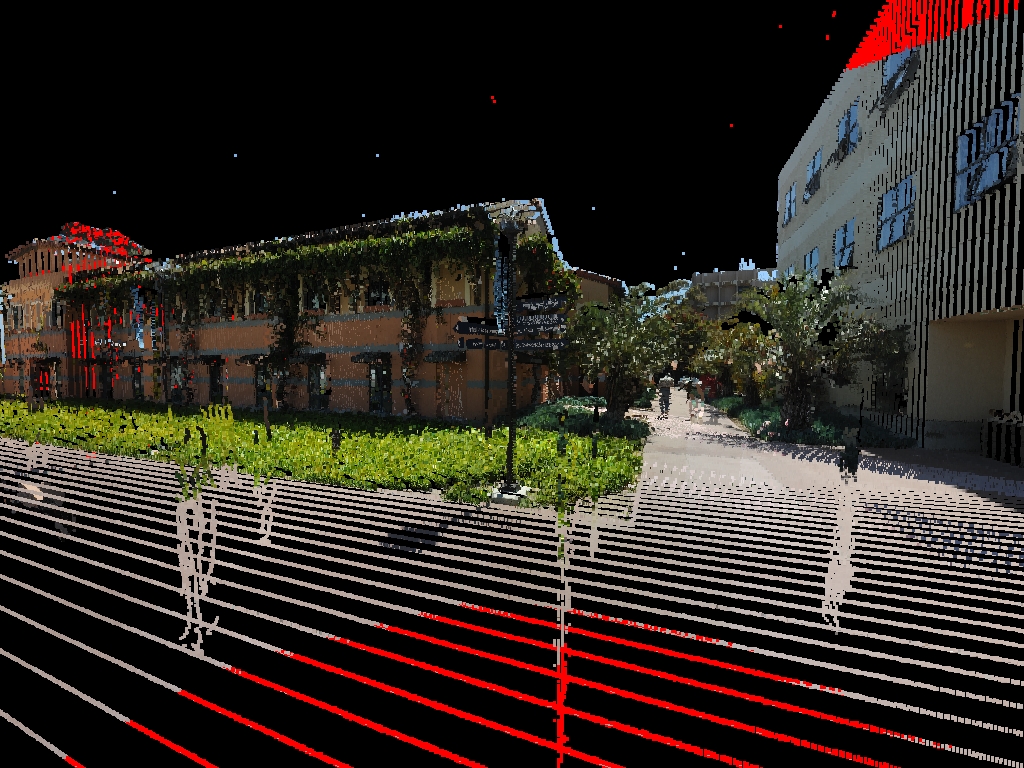


I’m not sure if I continue this project, but the next steps would be to see how many more points can be rendered in real time, to implement a spatial hierarchy and to evaluate other rendering techniques.